Cyclones in The Bay of Bengal
Thanks to Gaston Sanchez for a very informative Rpub, Visualizing Hurricane Trajectories. His post has led me to the data set and consequently to creating this post.
Source code
Keeping the length of the post in mind, I am not including the code that was used to generate the plots here. The data, code and the generated images are available at github.com/sainathadapa/plotting-cyclones. Please feel free to create an issue at the github repo or comment here if any part of the code is unclear.
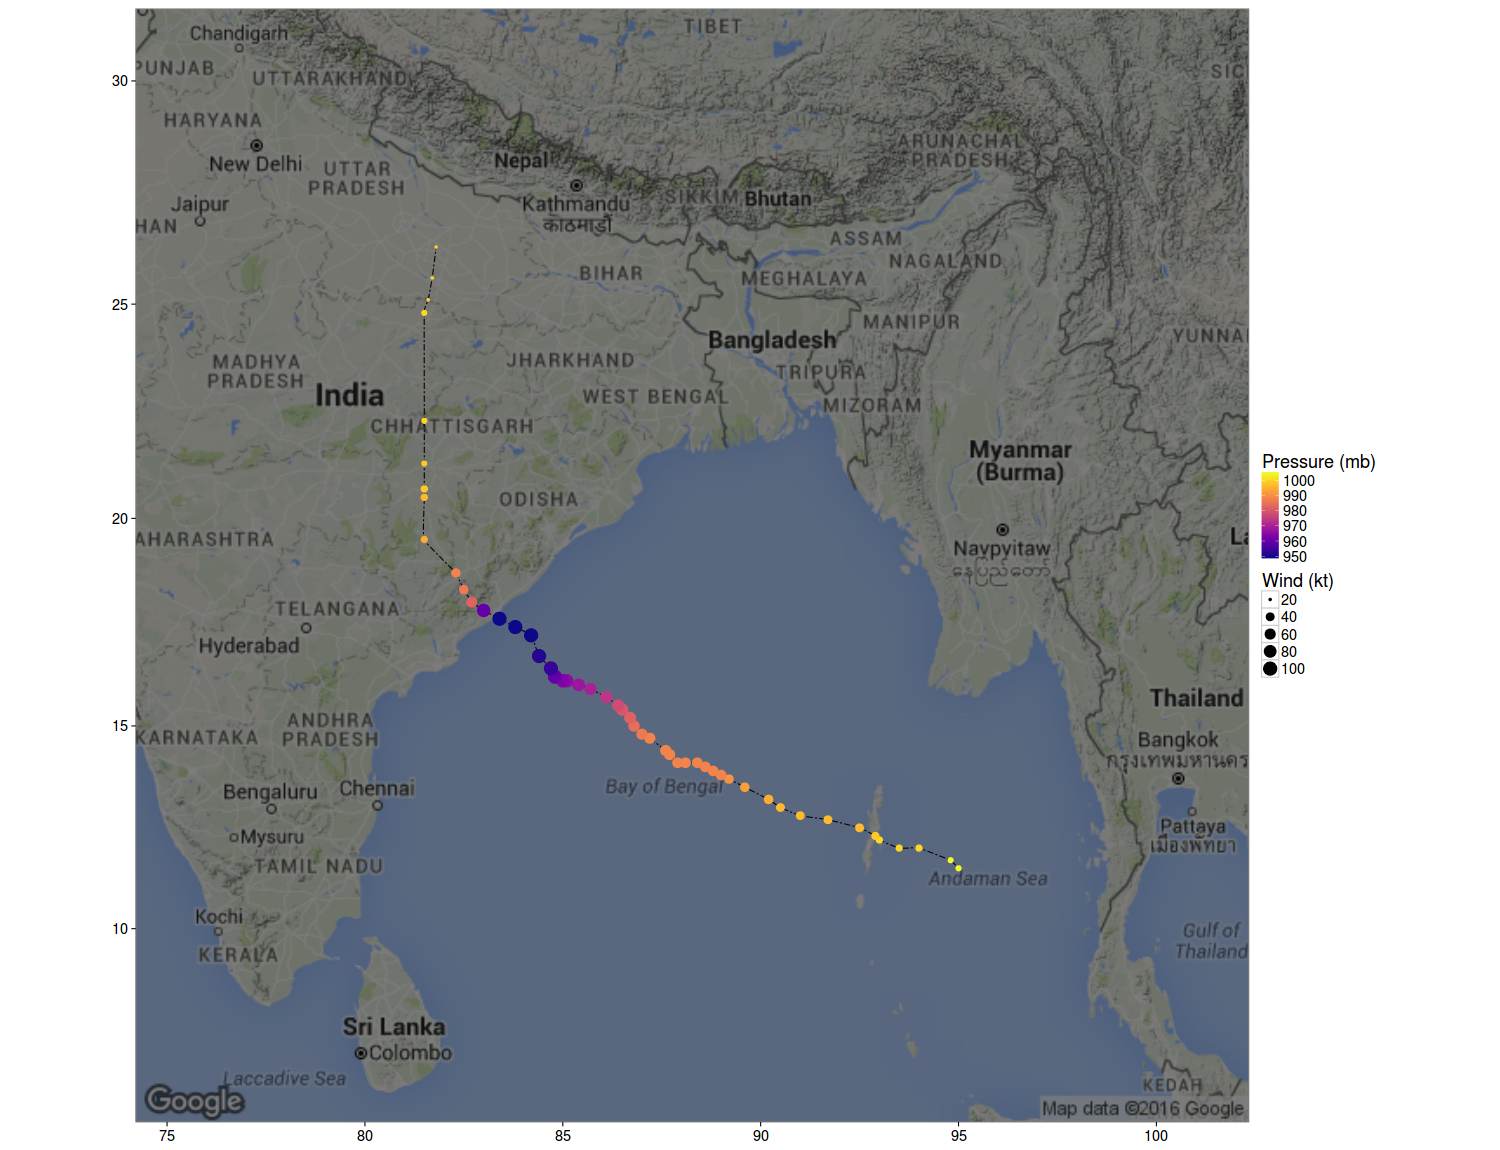
Path of a cyclone
Shown below is the path of the HudHud cyclone that devastated Visakhapatnam in 2014.
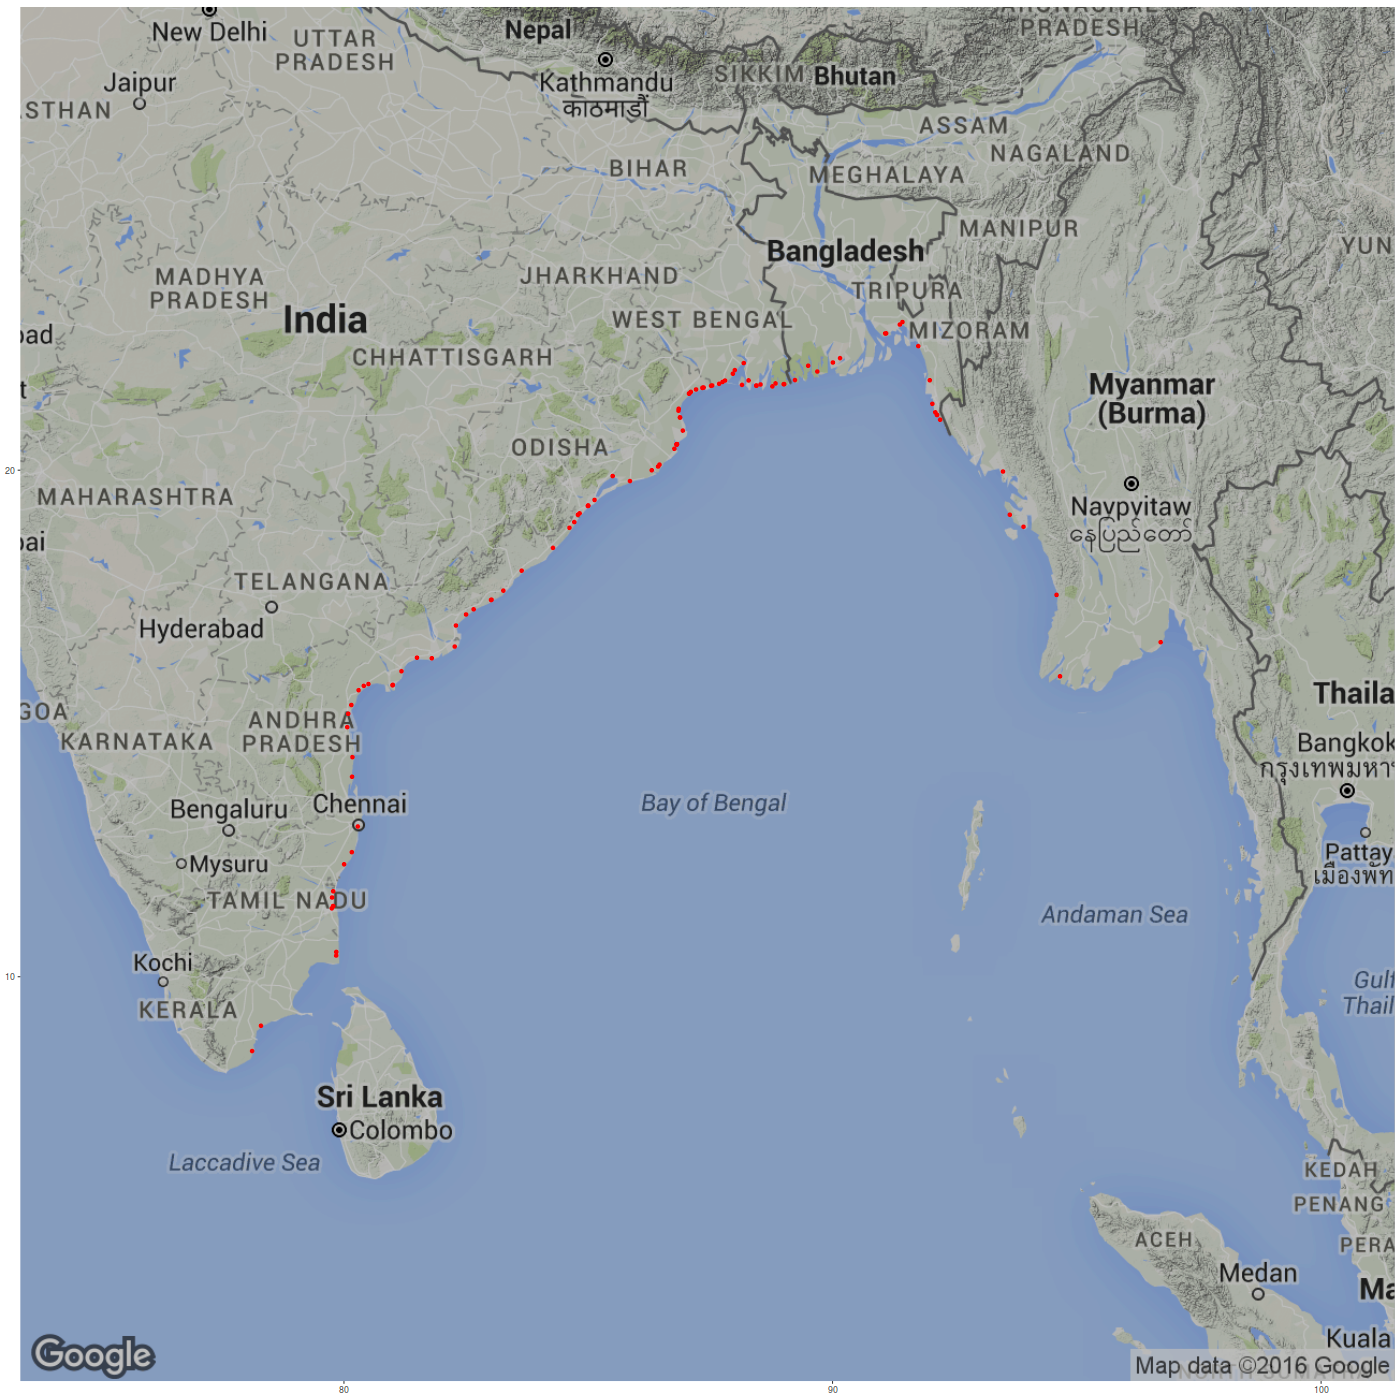
Cyclone landfall locations
Finding the cyclone landfall locations turned out to be little tricky since the data set didn’t have that information. With a little help from the sp and the maps packages, I was able to find the intersections between the cyclone paths and the coast.
Cyclone intensity along the east coast
I needed a way to visualize the cyclone intensity and the landfall locations. One way to represent this is to use size of the point as an indication of the Wind speed. (Assuming Wind speed is a good indicator of a cyclone intensity.)
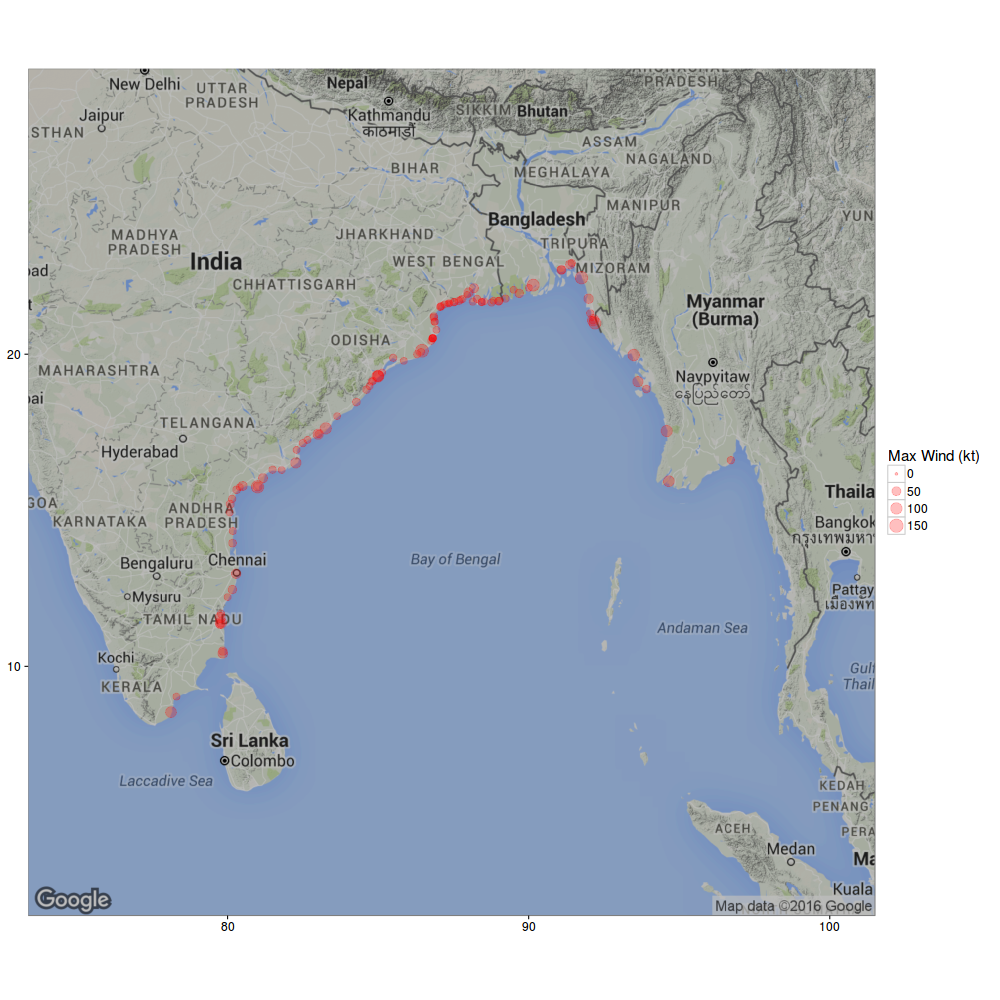
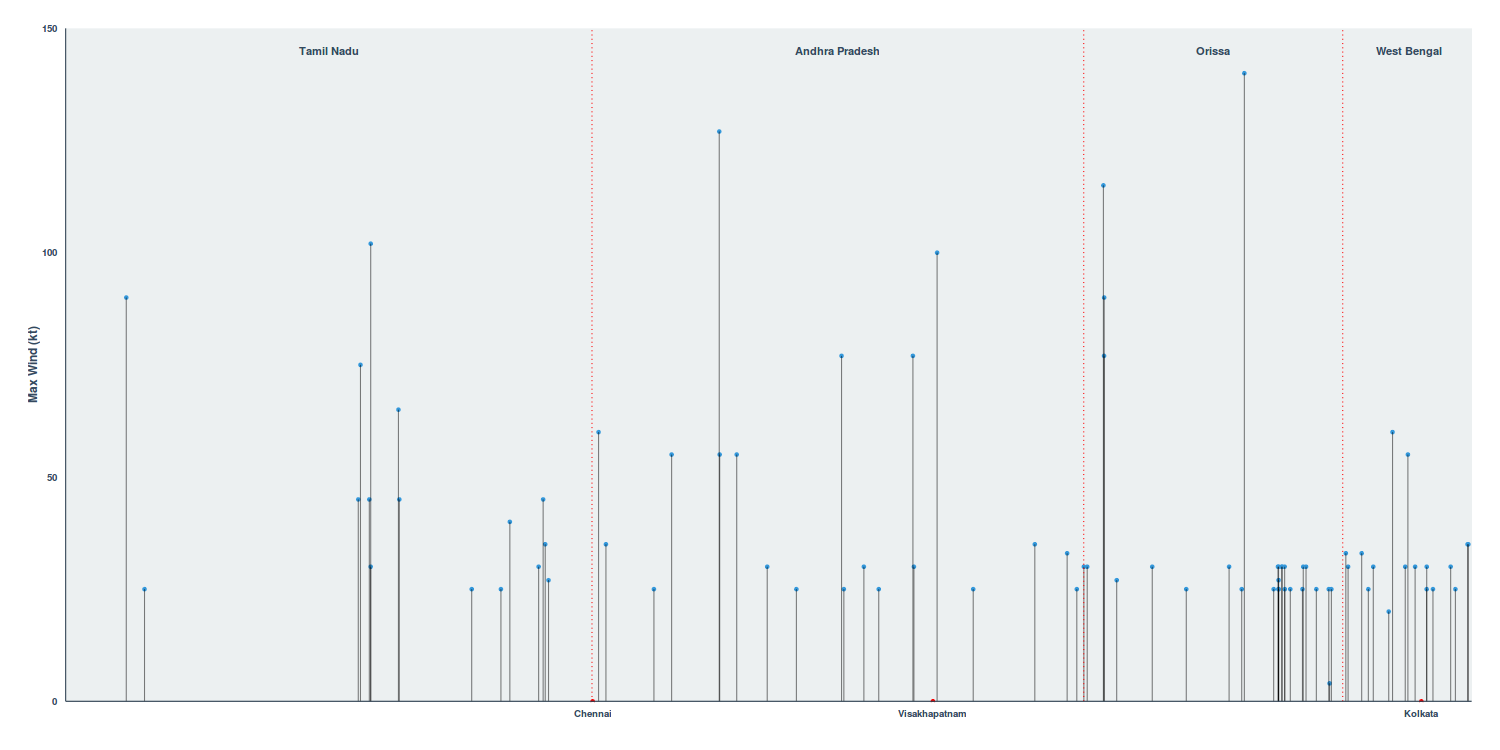
This doesn’t look like a optimal way of showing this information. And it is harder to make inferences from the above plot. A bar plot fits better. Translating geo-locations onto a single axis is difficult though. After approximating the east coast into a series of line segments and calculating the distance to each landfall point from the southern most tip, this is what I finally ended up with.
Trajectories of all the cyclones
And finally, an animation of paths of all the cyclones in the Bay of Bengal from the data set. Watch in 1080p to avoid the blurry video.
Note: This is an update to my previous post at Rpubs - Visualizing trajectories of Cyclones in Indian Ocean Basin.